Chrome DevTools Gives Coding Agents More Context, With Larger Trace Costs
Chrome adds paginated CSS inspection and chunked traces for agents. Learn to use the extra browser evidence safely.
On this page
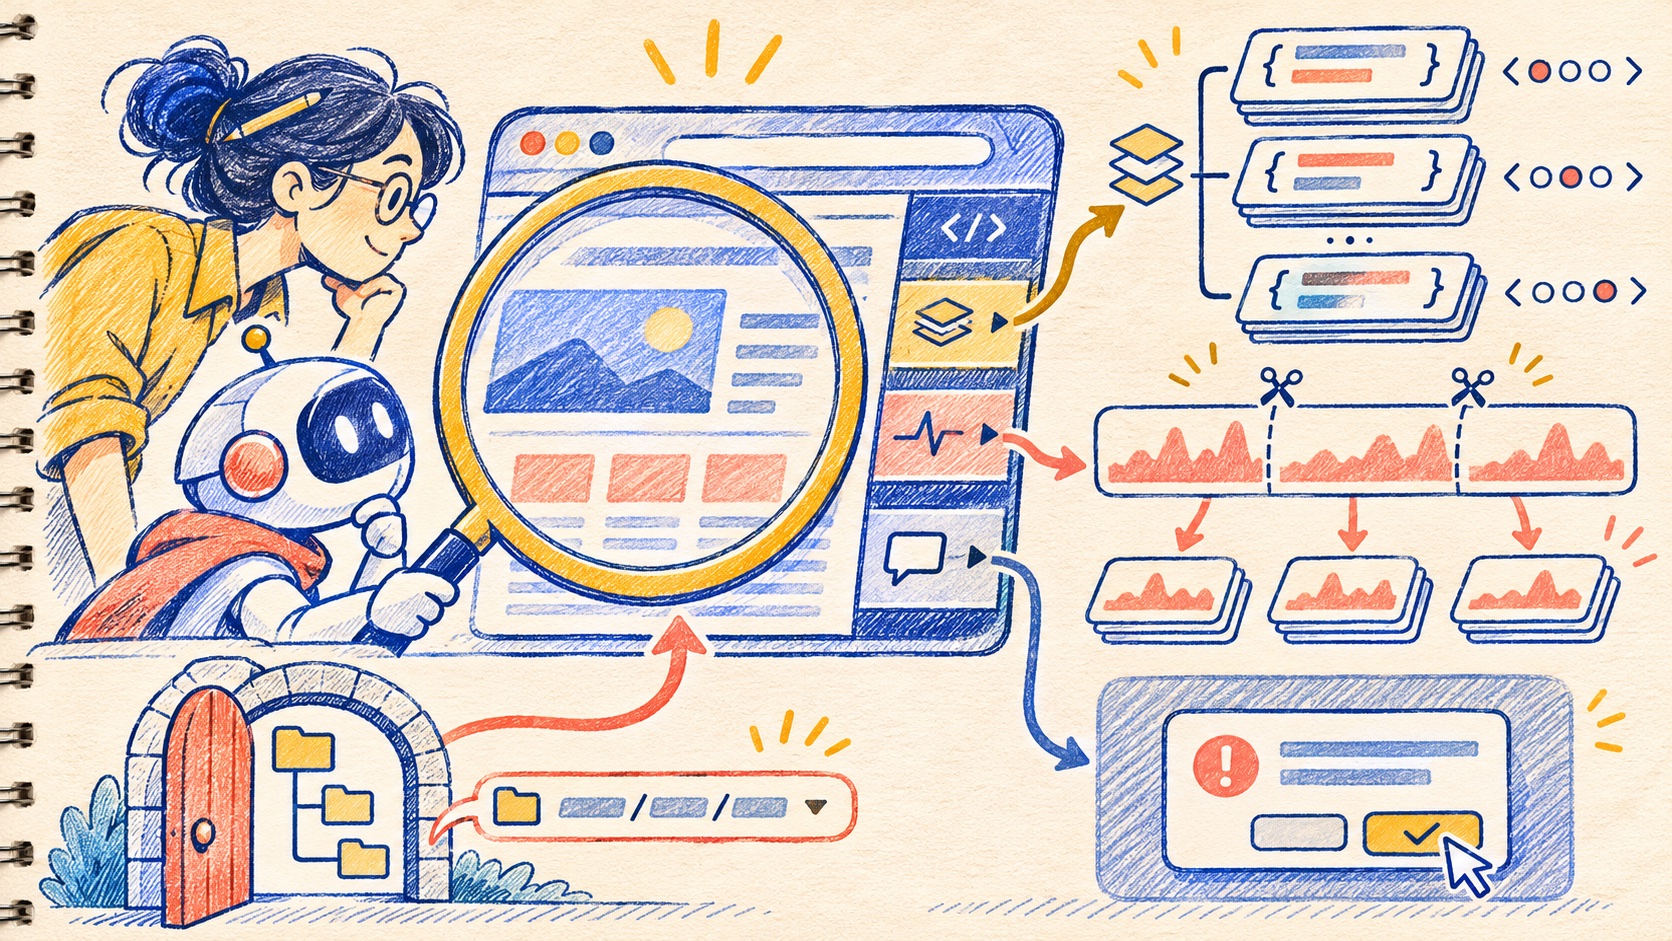
A browser agent can see that a button is wrong and still lack the evidence to explain why. The winning CSS declaration may be inherited from a distant component, while the performance trace may be too large to process as one response. Chrome’s November 2026 DevTools update adds tools aimed at those bottlenecks: paginated CSS inspection, chunked trace parsing, configurable paths, dialog handling and console persistence. [1]
CSS inspection becomes pageable evidence
The update adds a get_css_styles tool for inspecting computed and matched style information. Chrome says the output can include inherited rules, pseudo-elements and modern at-rules, and can be paginated with pageSize and pageIdx. That matters when an agent is diagnosing a layout problem: rather than guessing at a selector from the visible result, it can inspect the cascade rules attached to the element and request additional pages when necessary. [1]
Pagination creates an important workflow choice. A tool that can return more CSS does not mean every page should be sent to the model immediately. Start with the selected element and the first page, check whether the winning declaration explains the visual symptom, then request inherited or later rule pages only when the cause is still ambiguous. This keeps the debugging context tied to a specific element and observed behavior rather than dumping an entire stylesheet.
The repository’s tool reference describes matched rules, inline styles, inherited styles and cascade wrappers, including pagination. Its exact output format and behavior can evolve with the installed DevTools MCP version. Pin or inspect the version used in a repeatable debugging setup, and verify the result against the DevTools UI when a style conclusion affects a release. [2]
Large traces are still large
Chrome’s update also adds chunked parsing for performance recordings and says the default trace buffer is 1.2 GB. Chunking changes how the parser handles a large recording; it is not a promise that the file is small, that every machine can analyze it cheaply, or that an agent will find the relevant interval automatically. [1]
A useful analysis still begins with a focused capture. Record the interaction that reproduces the regression, annotate the relevant time span, and ask the agent to inspect a specific interval or trace insight. If the trace is broad, the agent should summarize what it has examined and identify remaining gaps before proposing a fix. The parser can make a large trace processable in pieces, but it cannot make an unscoped capture informative by itself.
Paths and dialogs change the automation boundary
The roundup describes a dedicated configuration file, custom filesystem roots and CLI path controls, including --allow-unrestricted-paths. It also notes automatic handling of JavaScript dialogs triggered during input actions and console history that survives same-document navigation. These are useful workflow affordances: browser tests can proceed through dialogs, and a same-page navigation no longer necessarily erases diagnostic history. [1]
They also deserve explicit boundaries. Filesystem access should match the repository or fixture the agent needs, not the entire workstation. Review the effective configuration used by the CLI and client; do not infer that a setting is harmless because the agent is running locally. Dialog handling should be paired with clear test expectations so an unexpected confirmation prompt is surfaced rather than automatically accepted as if it were part of the intended user journey.
Console persistence is continuity, not completeness. A retained message can help explain an error that happened before a route transition, but a clean console does not prove that network requests succeeded or that the page is correct. Pair the console with DOM state, network evidence and a visual check.
A disciplined agent debugging loop
For a layout issue, capture the affected element and viewport, inspect its matched styles, follow inherited rules if needed, then compare the computed values with the rendered result. For a performance regression, capture a narrow reproduction and ask for a trace summary tied to a specific interval. Keep the agent’s proposed fix separate from the browser evidence that supports it.
The update’s practical benefit is more structured access to browser evidence. It can make agent debugging less dependent on screenshots alone and reduce manual copying of cascade details. But the evidence remains a partial view of the application. Verify the real user-facing behavior after a change, and keep filesystem access, dialogs and browser state within an explicit test boundary.
Chrome’s own release roundup is dated October 20 and describes features arriving with Chrome 155 and 156 in October, not a newly shipped Chrome major version on November 18. Teams should consult the current DevTools build and repository documentation for exact availability rather than treating the monthly article date as a version number. [1]
Frequently asked questions
What changed in Chrome DevTools for agents in November 2026?
Chrome's November DevTools update adds paginated computed and matched CSS inspection, configuration and filesystem path controls, chunked trace parsing, automatic dialog handling, and console history persistence for agent workflows.
Does chunked trace parsing mean a trace is smaller?
No. Chunking changes how the parser processes a large recording; it does not claim the original recording uses less memory or contains less data. The announced default trace buffer is 1.2 GB, so teams should still scope captures and monitor resource use.
What should developers consider about unrestricted filesystem paths?
Chrome's announcement says the CLI supports --allow-unrestricted-paths by default. Review the current configuration and filesystem-root behavior for your installed version, and grant an agent access only to directories needed for its task.
Sources & further reading
Keep reading
GitHub Event Streams Replace Polling for Pull Requests, With a Reconnect Caveat
GitHub Event Streams send pull request updates over SSE, but clients must reconcile missed, repeated, or out-of-order events.
Visual Studio 18.12.1 Fixes Two Workflow Bugs; the Bigger Update Shipped Earlier
Visual Studio 2026's Nov. 17 servicing update fixes Hot Reload and JavaScript diagnostics. Its repository File System view arrived in 18.12.0 a week earlier.
Claude Code Architecture: Memory Systems, Permission Guardrails, Hooks, and Parallel Subagents
How to use Claude Code as an engineering platform: persistent CLAUDE.md memory, permission guardrails, automated hooks, and parallel subagents.
/* Comments */
Comments are offline right now — we reconnect automatically, nothing is lost.