Google’s New Rainfall Data Makes the Satellite Gap Easier to See
PARDIG and SatWeave open precipitation estimates and harmonized satellite observations. Their value depends on latency, calibration and sensor coverage.
On this page
When a storm crosses a mountain watershed, the nearest rain gauge may be many kilometres away or stop reporting just when conditions get dangerous. Satellites provide a wider view, but different instruments, viewing angles and cloud conditions leave gaps. Google’s PARDIG and SatWeave releases aim to make that observation layer easier to analyze and reuse.
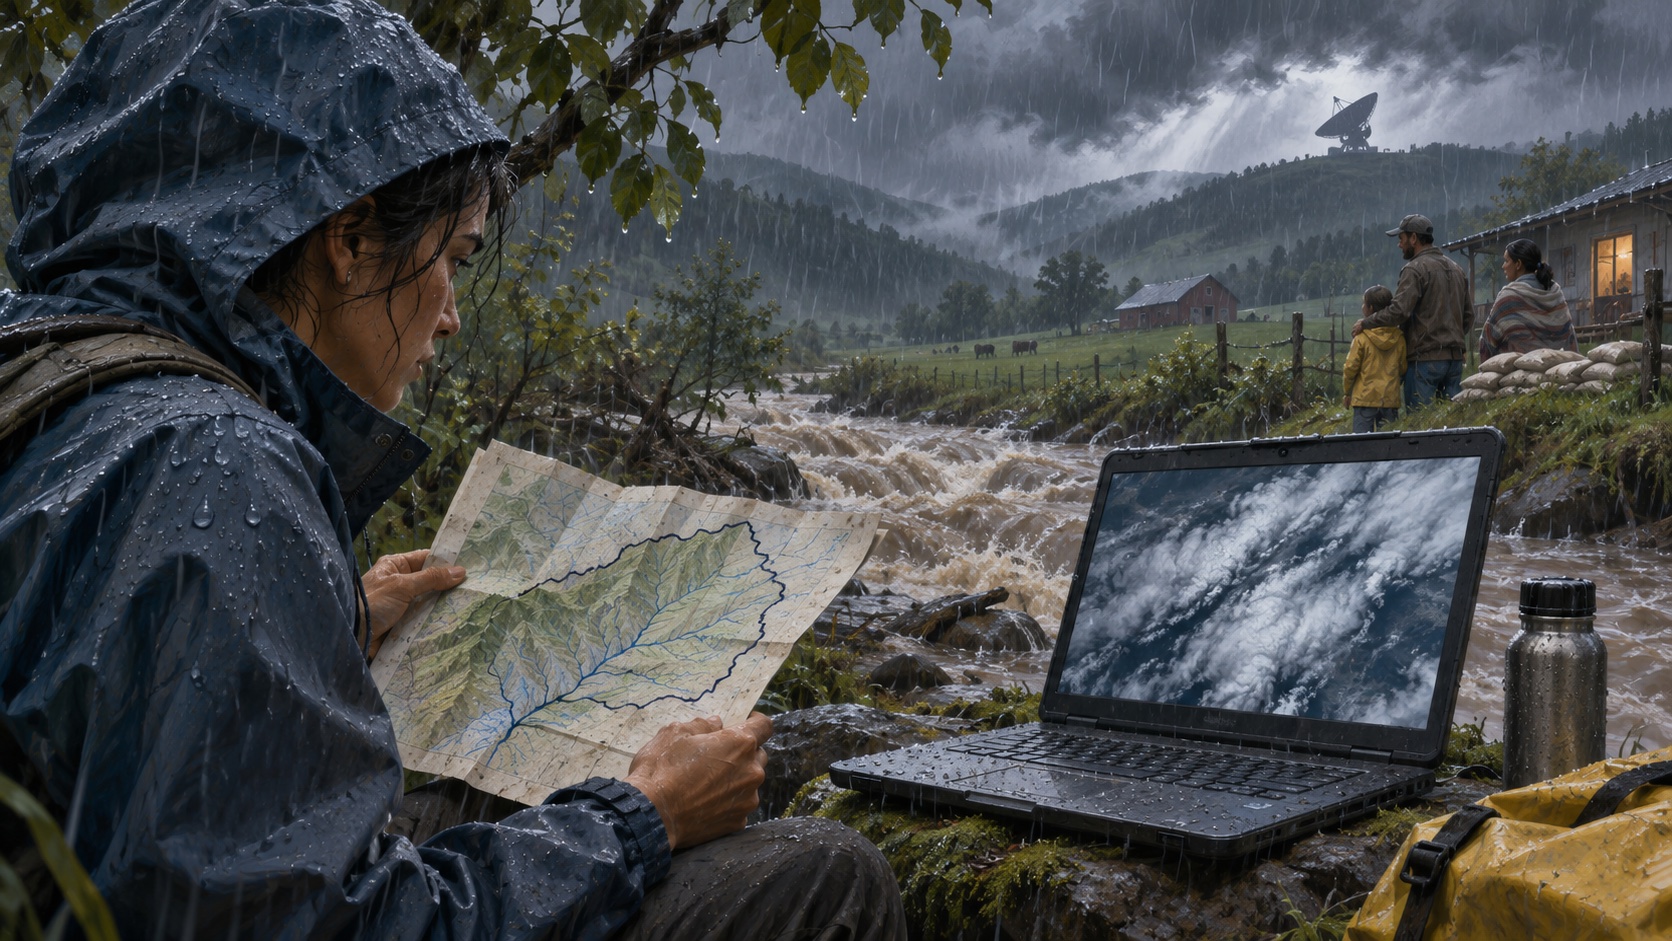
SatWeave harmonizes imagery from five geostationary satellite positions—GOES-East, GOES-West, Meteosat Prime, Meteosat IODC and Himawari—across 17 spectral bands. Google documents a 0.1-degree grid, 30-minute timesteps for the 2016–2025 archive and hourly timesteps from 2026 onward, with around one hour of live latency. PARDIG estimates precipitation on a global 0.1-degree grid at 15-minute intervals, using observations from the NASA/JAXA Global Precipitation Measurement mission among its training inputs. [1] [2]
Two datasets, different roles
SatWeave is the observation mosaic: a consistent, analysis-ready representation of geostationary imagery. It includes visible, near-infrared, shortwave-infrared, water-vapor and thermal-infrared channels. PARDIG is an estimate product. Its model learns from sparse spaceborne radar and radiometer observations and uses satellite imagery and atmospheric fields to infer precipitation between those measurements. [1] [3]
The distinction is consequential. A sensor reading has its own calibration, footprint and uncertainty. A model estimate adds learned assumptions about how observed cloud patterns relate to rain. That can provide spatially complete data useful for research and forecast training, while still disagreeing with a rain gauge or missing unusual local conditions. A 0.1-degree grid is also roughly ten kilometres: useful for regional analysis, too coarse to describe every street or drainage catchment.
The near-real-time product is not “live” in the ordinary consumer sense. Google’s release notes say PARDIG-NRT is updated every six hours; the effective latency is about two to eight hours, averaging roughly five. The archive reaches from 2016 to the present. A separate long-range product covers 1999–2023. Both products and SatWeave are listed under CC BY 4.0, which permits reuse with attribution under that license’s conditions. [2]
Why a learned estimate can help—and mislead
Satellite precipitation retrieval is an inverse problem. Instruments do not observe rainfall everywhere at ground level. GPM’s radar and radiometer provide high-value measurements along satellite tracks, while geostationary satellites continuously observe broad areas with different bands and viewing geometries. PARDIG attempts to use the first as a learning target and the second as context. The authors report that the product outperforms leading global baselines across analyzed rain rates and that WeatherNext 3 forecasts improve when trained to predict PARDIG. Those are research results from the developers and should be checked against the paper’s evaluation and domain limits. [3]
Sparse labels are the central tradeoff. The model can extend coverage beyond where direct radar observations exist, but that extension is inferred. Performance may vary across terrain, seasons, storm types and sensor geometry. A benchmark average can hide the extreme events that matter most for warning decisions. The data should not be described as independent confirmation of a forecast if the forecast model was trained on the same estimates; that would blur the line between input and validation.
A careful way to use the release
For climate or hydrology research, start by matching the product and timestamp cadence to the question. Preserve the file’s time coordinate, units, grid, missingness and version. Compare PARDIG with independent gauges or radar over the region and season of interest. If the task concerns flood risk, evaluate extremes and lead-time decisions rather than only overall correlation.
For an operational pipeline, instrument the freshness delay and show users when the newest estimate actually represents. Keep a fallback for missing or delayed tiles. Store provenance so a downstream chart can distinguish measured inputs from model estimates. Do not allow a ten-kilometre grid to imply household-scale certainty.
The most useful effect of opening the datasets may be reproducibility: researchers can inspect the same harmonized inputs and test where the estimates help or fail. Better coverage does not eliminate the uncertainty between a satellite and a stream bank. It gives analysts another evidence layer—and makes it more important to label what was observed, what was inferred and how late the information arrived. For the forecasting model built on this wider observation pipeline, see our earlier examination of WeatherNext 3 and the forecast-to-decision gap.
Frequently asked questions
What are PARDIG and SatWeave?
SatWeave is a harmonized multispectral geostationary satellite dataset. PARDIG uses sparse spaceborne radar and radiometer observations, with satellite imagery and atmospheric fields, to estimate global precipitation at 15-minute intervals.
Are PARDIG estimates direct rain measurements?
No. They are machine-learning estimates trained using satellite observations and other inputs. The distinction between observation and estimate matters when using the data for operational decisions or comparing against ground gauges.
Can these datasets be used for real-time flood warnings?
The near-real-time PARDIG product has several hours of effective latency, so it is not an instantaneous sensor feed. Any warning system needs local validation, gauge or radar sources, latency monitoring and operationally approved decision rules.
Sources & further reading
Keep reading

AI Agents Proved Signal Properties Down to Machine Code. The Specification Still Needs You
AlphaProof Code connects Lean proofs to libsignal’s compiled binary. What it proves, what remains trusted, and how teams can use the pattern.

Self-Hosting an AI Agent Moves the Boundary, Not the Model Call
Anthropic’s beta lets teams host the agent service, sandboxes and history. Model requests still leave for a provider, so data-flow review matters.

IBM’s LLMON Tries to Put a Boundary Between Instructions and Data
LLMON structures model context and reports lower indirect-injection success in selected tests. It is promising, but not a security boundary.
/* Comments */
Comments are offline right now — we reconnect automatically, nothing is lost.