cuPhoton and Black-Hole Interferometry: Accelerating Correlation Is Not Imaging
NVIDIA's cuPhoton.xBeam targets VLBI data correlation; calibration and image reconstruction remain separate scientific stages.
On this page
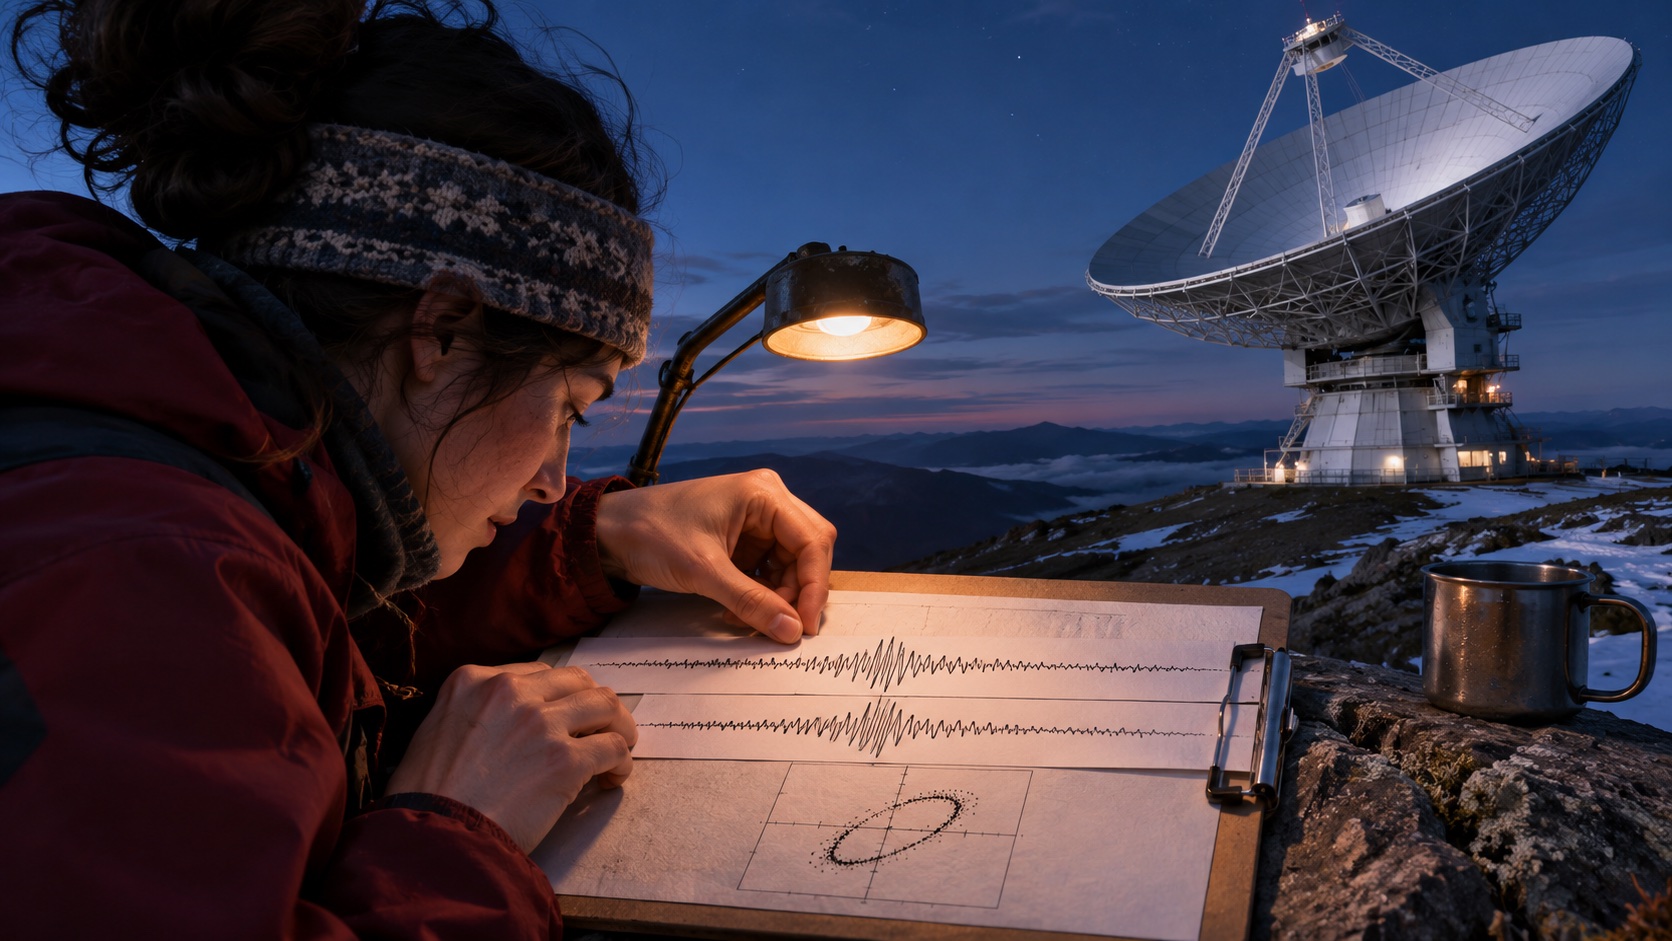
Very-long-baseline interferometry (VLBI) combines synchronized radio observations from distant telescopes. The correlator pairs station recordings and produces complex visibilities indexed by baseline, frequency channel, and time interval. NVIDIA’s November 13 cuPhoton post focuses on accelerating this correlation stage through cuPhoton.xBeam. That is important compute, but it is not the complete path from telescope data to a black-hole image. [1]
Correlation is one stage
The visibility measurements encode phase and amplitude relationships between station pairs. Calibration corrects instrumental and atmospheric effects; imaging then uses the calibrated measurements to infer a sky brightness distribution. Those stages require their own algorithms, data-quality decisions, and scientific validation. A faster correlator can reduce preprocessing time without changing those later steps.
NVIDIA reports processing 10 TB in 70 seconds on a 64-GPU Vera Rubin NVL72 with its stated GPUDirect Storage compatibility mode, comparing that with a 31,992-second CPU baseline. This is a vendor benchmark with a particular dataset, hardware, and pipeline boundary. It should not be read as a 460-fold end-to-end improvement to black-hole imaging. Independent teams should reproduce the input format, channelization, integration settings, I/O path, and output checks before applying the number to their own observatory workflow.
Scientific validation still matters
A useful evaluation compares visibility values with a trusted correlator, including phase and amplitude error across representative baselines and frequencies. It should account for missing packets, clock offsets, quantization, and data movement. Throughput alone does not establish that the output is scientifically equivalent.
The Event Horizon Telescope’s first M87* result depended on a global observing network and a carefully validated imaging process. [2] A November 11 Nature paper offers a timely example of the separate downstream problem: GenDIReCT, a different learning-based imaging method, used EHT observations from 2017, 2018, and 2021 to recover compact ring-like structures from closure-invariant observables. That reconstruction is not an output of cuPhoton.xBeam. [3]
GPU acceleration can make larger or faster correlation workloads practical, but the scientific claim rests on the whole measurement and reconstruction chain.
cuPhoton’s technical contribution is a GPU path for one computationally intense stage. Keeping that boundary clear helps distinguish systems performance from scientific inference.
Data movement can dominate a faster correlator
A VLBI correlation workload begins with large station recordings that must be read, routed into compatible time and frequency windows, paired, and accumulated. The effective rate is limited by the slowest stage among storage, decode, transfer, correlation, and output. GPUDirect Storage compatibility mode describes an I/O path in NVIDIA’s demonstration; it does not establish that every observatory storage layout can feed GPUs at the same rate. Dataset layout, file system, preprocessing, and buffer reuse all affect end-to-end time.
A reproducibility report should state station count, baselines, sample representation, channelization, integration time, polarization products, flagging behavior, and output format. Compare visibility arrays against a trusted correlator using scientifically meaningful phase and amplitude tolerances. Include edge cases such as missing or flagged samples and verify deterministic handling of time alignment. A faster kernel is not useful if the produced data differ in a way the calibration pipeline cannot tolerate.
The distinction among correlation, calibration, and imaging also matters for project planning. Correlation can return visibilities; calibration estimates and corrects instrumental effects; imaging reconstructs a sky model from incomplete baseline coverage. Researchers may spend substantial time in calibration and iterative imaging even after raw correlation is accelerated. Measure those stages before claiming a total project-time reduction. The M87* result is a scientific outcome of a collaboration and analysis process, not simply an output format emitted by a GPU kernel.
When presenting benchmark results, report accelerator count and model, I/O mode, CPU baseline configuration, whether loading and writing are included, and the same correctness checks on both paths. NVIDIA’s 70-second figure is a strong vendor-reported correlation result for its stated setup. Independent replication and end-to-end workflow measurements are needed before translating it to a facility’s observing schedule.
Validate the full measurement chain
Benchmark with a representative observation, not only a small synthetic block that fits in cache. Include realistic stations and baselines, data volumes, flags, timestamps, and interruptions. Test incomplete files or late station data. Confirm output conventions and metadata: a numerically plausible array with incorrect time or baseline labels is unusable downstream.
If correlation becomes much faster, calibration or storage may become the new bottleneck. Profile stage durations before and after acceleration and account for CPU orchestration, staging, and result validation. The useful system metric may be usable observation hours per day, not kernel time. For context on GPU allocation, see NVIDIA’s scheduler release; shared-cluster contention should be controlled during a performance comparison.
Frequently asked questions
Does cuPhoton produce the final black-hole image?
The described xBeam stage accelerates correlation and produces complex visibilities. Calibration and image reconstruction are separate stages.
What is a visibility in VLBI?
It is a complex correlation associated with a pair of observing stations, a frequency channel, and an integration interval; calibrated measurements feed later imaging.
How should the performance claim be evaluated?
Reproduce the input, baseline, channelization, integration, I/O mode and output checks, then measure data movement and the full pipeline rather than the correlator alone.
Sources & further reading
Keep reading

NVIDIA SOMA Retargeter: Turning Human Motion into Robot Trajectories
NVIDIA SOMA Retargeter turns SOMA BVH motion into robot-specific trajectories using scaling, IK, and foot-plant correction—not a validated robot policy.

AlphaGenome 2 Tries to Find the Cell Where a DNA Variant Matters
Google DeepMind's AlphaGenome 2 conditions predictions on cell type and state, aiming to connect genetic variants with the cells where their effects appear.

RIKEN’s AI for Science Plan Starts With the Lab, Not a General Assistant
RIKEN-AXIS links scientific AI, human-led experiments and shared research facilities. Its promise depends on open access and rigorous validation.
/* Comments */
Comments are offline right now — we reconnect automatically, nothing is lost.