Compiler-Built Device Graphs Target the Cost of Recording GPU Work
Modular says compiling a known execution graph can avoid runtime capture overhead. Here is what its claim means, where graph replay helps, and what to measure.
On this page
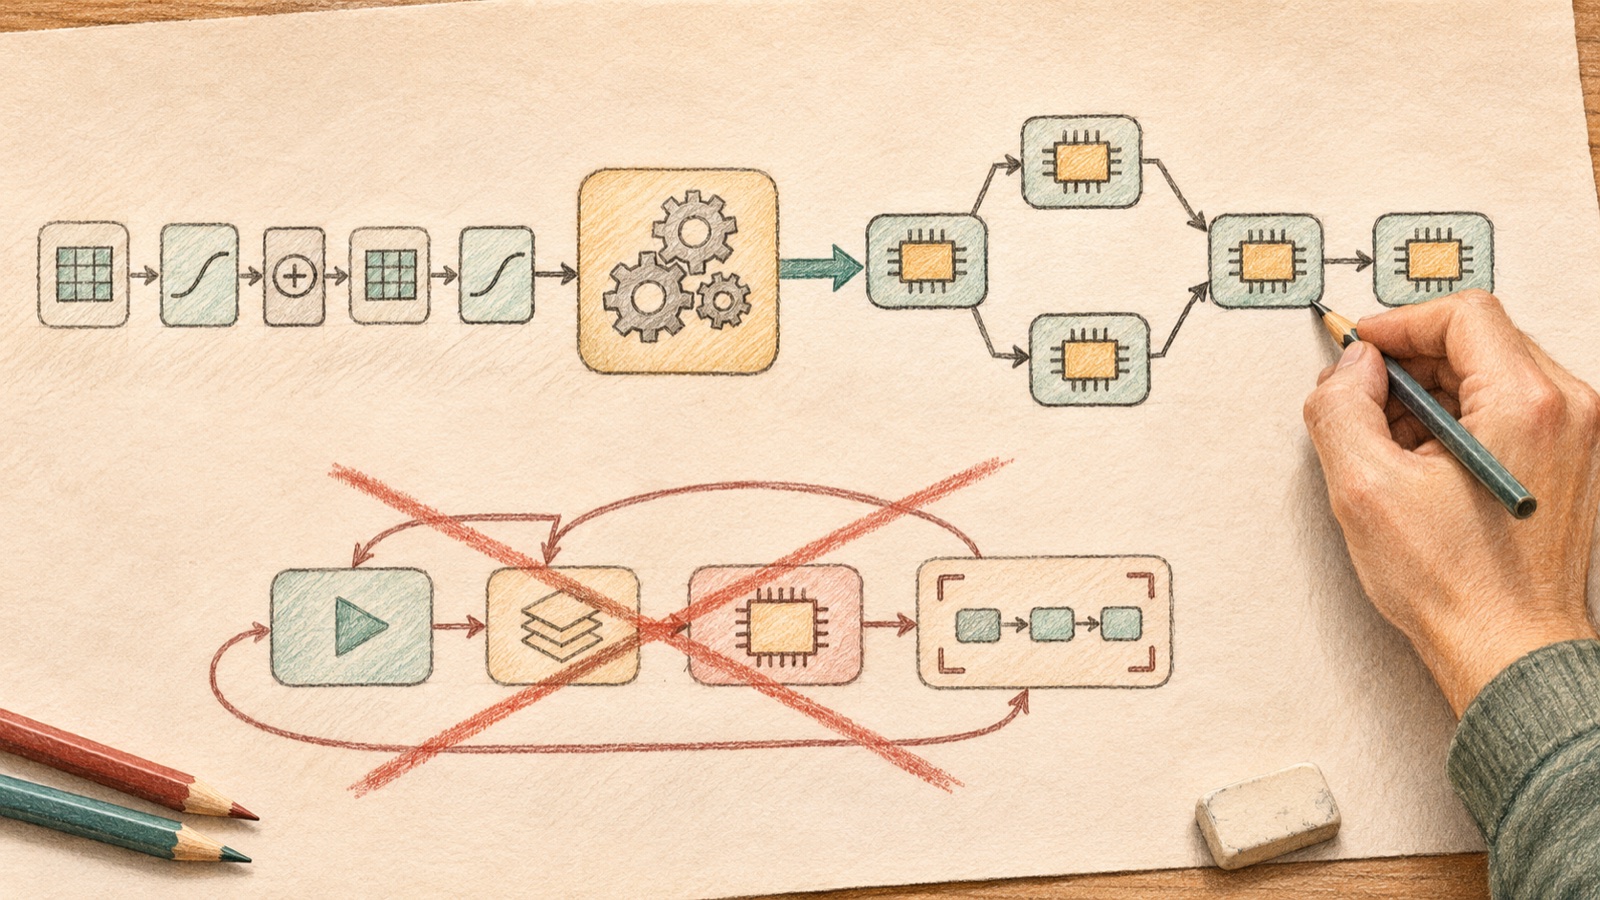
Many inference loops do the same work repeatedly: copy inputs, launch kernels, move intermediate data, run another kernel, then return results. Reissuing each operation from the host can add overhead. CUDA and HIP graph APIs let applications describe a sequence and replay it. Modular’s November 16 account describes a compiler taking a different route: when the compiler already knows the sequence, it can construct the device graph directly rather than recording one live execution. [1]
The overhead is outside the kernel
A GPU kernel may execute quickly while the surrounding runtime still spends time preparing, dispatching and coordinating work. This gap becomes visible when a workload issues many short operations or repeats a fixed sequence. A graph can make dependencies explicit and let the runtime prepare execution as a unit. NVIDIA describes graph definition, instantiation and launch as separate stages; AMD documents a corresponding HIP graph API. Both are useful when the same pattern runs repeatedly, but setup and graph management still exist. [2] [3]
The traditional capture path records operations while the program executes them. That is convenient when the runtime calls themselves are the only reliable description of what will happen. It also means capture must deal with runtime state, memory behavior, streams, libraries and device-specific limitations. A compiler has another source of knowledge: the planned operation graph before execution. If that structure is sufficiently complete, it may build the backend graph without staging a recording run.
Modular says its work addresses complexity spread across graph execution, asynchronous runtime, memory pools, kernels and drivers. It reports a production Gemma 4 model running end to end through device-graph synthesis, including multiple graph regions in one model, and says direct construction is about 40% faster than recording. Implementations named in the post cover CUDA, HIP and Qualcomm AI100 behind one interface. Those are useful signs of practical coverage, but the post does not publish a reproducible benchmark setup, hardware matrix or independent comparison. The number should therefore be read narrowly as a company-reported graph-building result, not a promise that model latency falls by 40%. [1]
Where direct construction can help
The compiler route is attractive when the execution structure is known before launch and repeated enough to make setup worthwhile. Think of a serving path with a stable sequence of operations, or a region inside a larger graph that remains unchanged across many requests. The compiler can translate that region into native graph nodes and preserve dependencies it already knows. That could reduce capture overhead and make unsupported runtime-capture cases less awkward.
It is less compelling when the workload changes shape or control flow on every call, when operations depend on values only available at runtime, or when a library owns work that the compiler cannot describe. A device graph is not magic dynamic execution: the implementation still needs a way to update parameters, manage buffers, handle errors and fall back when a graph cannot represent a path. Some programs may benefit from graphing only a stable subregion rather than wrapping an entire request.
The portability promise also needs careful reading. A shared interface can hide differences in vendor APIs, but it cannot make every backend feature identical. CUDA and HIP have their own graph types, capture rules and version-specific behavior. A compiler’s common abstraction is valuable precisely when it preserves the ability to reason about the target-specific constraints rather than pretending they have disappeared.
What an inference team should test
First measure the actual bottleneck. Compare host launch time, device utilization and end-to-end latency on a representative request mix. Then separate graph construction or capture cost from replay cost. A one-time improvement during initialization may matter for short-lived jobs but barely affect a long-running server; a replay improvement may matter only for workloads that revisit the same structure.
Benchmark at least three paths: the existing eager launch route, the current capture-and-replay route, and any compiler-built graph route available in the stack. Keep model weights, input shapes, batching, warm-up, synchronization and device clocks consistent. Track tail latency as well as average latency, memory use, compilation time, graph-update behavior and correctness across supported devices. Do not compare a graph-construction number with request latency.
Also test the awkward cases: shape changes, optional branches, buffer lifetimes, concurrent requests, errors during setup and workloads that cannot be captured. A fallback matters because a fast path that silently rejects legitimate inputs is not a production improvement. Record the conditions under which graph reuse is valid so future model changes do not turn an optimization assumption into a correctness bug.
The broader compiler lesson is modest and useful: if a system knows the execution structure earlier than the runtime does, it can sometimes choose a cheaper representation path. That does not remove backend complexity; it moves some of the responsibility into compilation and graph construction. The win is real only when the whole lifecycle—compile, build, update, replay and recover—fits the workload better than recording does.
For teams exploring this pattern, start with one stable, hot execution region and measure it end to end. For more context, see GPU and TPU memory behavior and continuous inference optimization. Treat the reported 40% as a hypothesis to investigate, not a sizing estimate. The right outcome may be a faster graph path, a smaller captured region, or the finding that ordinary launches are already cheap enough.
Frequently asked questions
What is a device graph?
A device graph describes a sequence of accelerator operations and dependencies that can be prepared and replayed with less repeated host-side launch work. CUDA and HIP provide graph APIs for this pattern.
Does compiler-built graph synthesis guarantee 40 percent faster inference?
No. Modular reports graph construction about 40 percent faster than recording in its own implementation. That is not a general end-to-end inference speedup, and the post does not provide an independent benchmark protocol.
When should a team consider graph replay?
It is most promising when a stable sequence repeats often enough to amortize graph setup and when the backend can represent the needed operations. Dynamic shapes, changing dependencies, and capture restrictions can reduce the benefit.
Sources & further reading
Keep reading
Meta’s TLX Targets the Missing Middle Between Triton and CUDA
TLX extends Triton with explicit warp-group scheduling and asynchronous memory control, exposing modern GPU hardware without requiring every kernel in raw CUDA.
Inside OpenAI's Stream Processing Platform: PyFlink, Kubernetes and Resilient Multi-Cloud Kafka
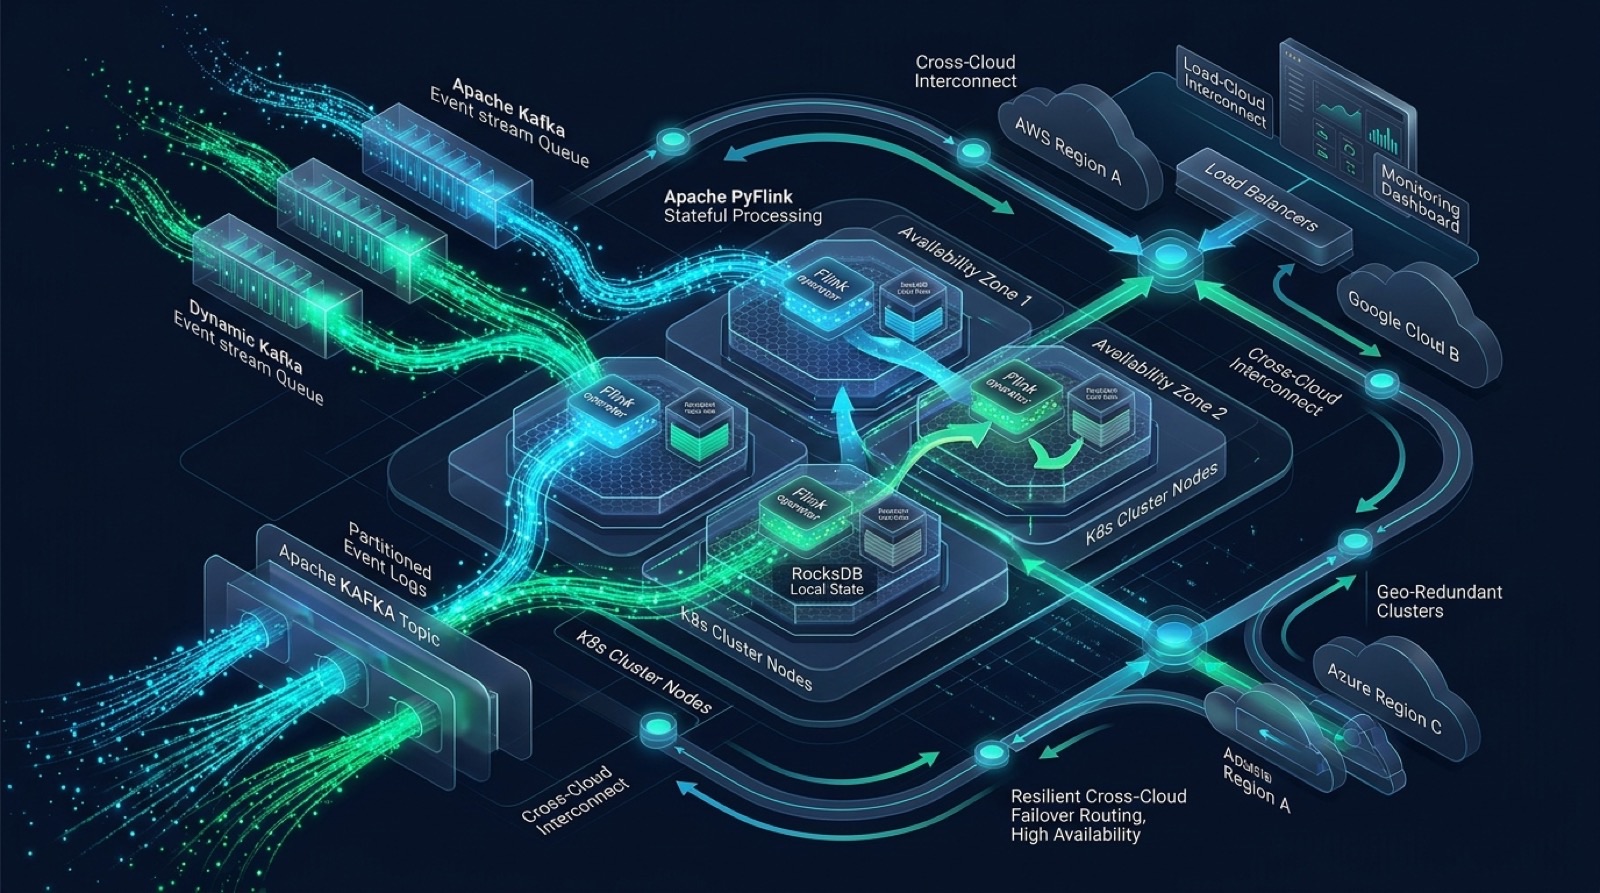
How OpenAI built a resilient Python-native stream processing platform on Apache PyFlink and Kubernetes that survives entire cloud region outages.

LinkedIn’s Cognitive Memory Agent: Durable Context for Hiring Assistants
LinkedIn’s memory platform separates conversational, episodic, semantic and procedural context, with explicit ingestion and retrieval controls.
/* Comments */
Comments are offline right now — we reconnect automatically, nothing is lost.