How the JVM Works: ClassLoading, Memory Models, and Tiered JIT Compilation
Explore the internals of the Java Virtual Machine: from javac bytecode and classloading stages to C1/C2 JIT compilation and memory layouts.
On this page
When developers run javac OrderService.java followed by java OrderService, an intricate multi-tier runtime springs into action. Unlike compiled languages such as Go or Rust that translate directly to native binary instructions, Java code compiles into platform-neutral bytecode executed by the Java Virtual Machine (JVM).
The JVM is often described as an interpreter, yet long-running Java services frequently match or exceed the raw throughput of compiled C++ binaries. How does an environment that begins with interpreted virtual bytecode achieve native execution speed?
The secret lies in the JVM execution pipeline: a hybrid architecture combining dynamic classloading, structured memory management, runtime profiling, and tiered Just-In-Time (JIT) compilation. This article analyzes how source code transitions from virtual stack operations to bare-metal CPU machine code.
The Core JVM Architecture
The JVM separates runtime execution into three distinct subsystems: the ClassLoader, the Runtime Data Areas (Memory Model), and the Execution Engine.

1. The ClassLoading Subsystem
Before any Java class can execute, the JVM must locate its binary representation on disk or over the network, parse its constant pool, verify bytecode integrity, and bind it into Metaspace memory.
Classloading occurs in three strict phases:
[ Loading ] ──────────► [ Linking ] ──────────► [ Initialization ]
  Reads .class bytes      1. Verification         Runs static initializers
  Defines Klass object    2. Preparation          <clinit> execution
                          3. Resolution
Loading
The JVM uses a hierarchical delegation model:
- Bootstrap ClassLoader: Written in native C/C++, loads core runtime classes from
java.base(such asjava.lang.Object,java.lang.String). - Platform (Extension) ClassLoader: Loads platform extension modules.
- Application (System) ClassLoader: Loads application dependencies and classes from the classpath.
When a class is referenced, a ClassLoader first delegates the request upward to its parent. Only if the parent fails does the child attempt to load the byte array.
Linking
Linking prepares the class for safe in-memory execution:
- Verification: An indispensable security boundary. The bytecode verifier examines instruction streams to guarantee stack invariants, ensuring code does not forge pointers, overflow operand stacks, or violate access controls.
- Preparation: Allocates memory for static fields and initializes them to language defaults (for example,
0,false, ornull), not custom business values. - Resolution: Transforms symbolic references in the bytecode constant pool into direct physical memory pointers.
Initialization
The JVM executes the static initializer block (<clinit>), evaluating user-defined static assignments and executing static code blocks in thread-safe order.
2. The JVM Memory Model
Once loaded, code and data are partitioned across five runtime data areas:
| Memory Area | Scope | Purpose | Garbage Collected? |
|---|---|---|---|
| Heap | JVM Process (Shared) | All instantiated objects and arrays. | Yes (ZGC, G1, ParallelGC) |
| Metaspace | JVM Process (Shared) | Class metadata, method bytecodes, runtime constant pool. | Yes (Class unloading) |
| Thread Stack | Per-Thread (Isolated) | Method stack frames, local variables, operand stacks. | No (Freed on return) |
| Program Counter (PC) | Per-Thread (Isolated) | Address of current bytecode instruction being executed. | No |
| Native Method Stack | Per-Thread (Isolated) | C/C++ JNI execution frames. | No |
Anatomy of a Stack Frame
Every thread possesses an isolated call stack. When a method is invoked, the JVM pushes a Stack Frame comprising:
- Local Variable Array (LVA): Stores method arguments and local variables indexed from
0. For instance methods, slot0always contains thethisreference. - Operand Stack: A Last-In-First-Out workspace where intermediate values are pushed and popped during arithmetic, method parameter passing, and return operations.
- Frame Data: Stores references to the runtime constant pool and method dispatch tables.
3. The Execution Engine: Interpreted to Tiered JIT
When a JVM process boots, compiling every method to machine code immediately would create massive startup delays. Instead, modern OpenJDK implementations (HotSpot) employ Tiered Compilation.
Method Call Count = 0
       │
       ▼
[ Tier 0: Interpreter ]  <── High startup velocity; slow execution
       │
       │ Invocations exceed threshold (~2,000 calls)
       ▼
[ Tier 1 - Tier 3: C1 Client Compiler ]  <── Fast compile, profiling instrumentation
       │
       │ Method identified as "Hot" (~15,000 calls + branch frequency)
       ▼
[ Tier 4: C2 Server Compiler ]  <── Heavy optimizations, escape analysis, vectorization
       │
       ▼
[ Code Cache ]  <── Direct bare-metal CPU machine code execution
The C1 Compiler (Client)
The C1 compiler prioritizes fast compilation time. It performs basic dead-code elimination and simple method inlining while injecting profiling hooks (MDO: MethodDataObjects) to measure execution frequencies, branch directions, and type distributions.
The C2 Compiler (Server)
When a method or loop executes repeatedly, it is marked as hot. The JVM schedules the method for C2 compilation, which applies aggressive optimizations:
- Aggressive Inlining: Eliminates method call overhead by copying the bytecode of small callee methods directly into the caller frame. This unlocks subsequent compiler optimizations across call boundaries.
- Escape Analysis: Determines if an allocated object escapes the scope of the declaring method. If an object is strictly thread-confined and does not escape, C2 can eliminate heap allocation entirely via Scalar Replacement, mapping object fields directly into CPU registers or stack slots.
- Loop Unrolling and Vectorization: Expands loop iterations to minimize branch penalties and leverages SIMD instructions (AVX-512) for parallel numeric operations.
- Monomorphic Call Devirtualization: Because Java methods are virtual by default, the runtime checks whether a polymorphic interface call actually encounters only a single concrete class at runtime. If so, C2 devirtualizes the call into a direct assembly jump.
Deoptimization: The Safety Valve
JIT optimizations rely on speculative execution. If C2 optimizes a method assuming an interface is only implemented by StripeProcessor, and hours later an application loads a PayPalProcessor plugin, the speculative assumption is invalidated.
The JVM executes an Uncommon Trap: it discards the compiled native code, reconstructs the interpreted stack frames on the fly, and drops execution safely back to the interpreter without crashing the process.
Practical Takeaways for Systems Engineers
- Warmup Profiles Matter: Benchmarking Java applications before the C2 compiler optimizes hot loops produces misleading performance numbers. Always run thorough warmup cycles during load tests.
- Metaspace is Native Memory: OutOfMemoryError in Metaspace indicates classloader leaks (often caused by dynamic proxy frameworks or hot-reloading). Monitor Metaspace separate from the Java Heap.
- Small Methods Win: The JIT inliner imposes strict bytecode size caps (default
-XX:MaxInlineLevel=9and-XX:MaxInlineSize=35). Small, modular methods are inlined aggressively, while monolithic 500-line methods are skipped by the optimizer.
Keep reading
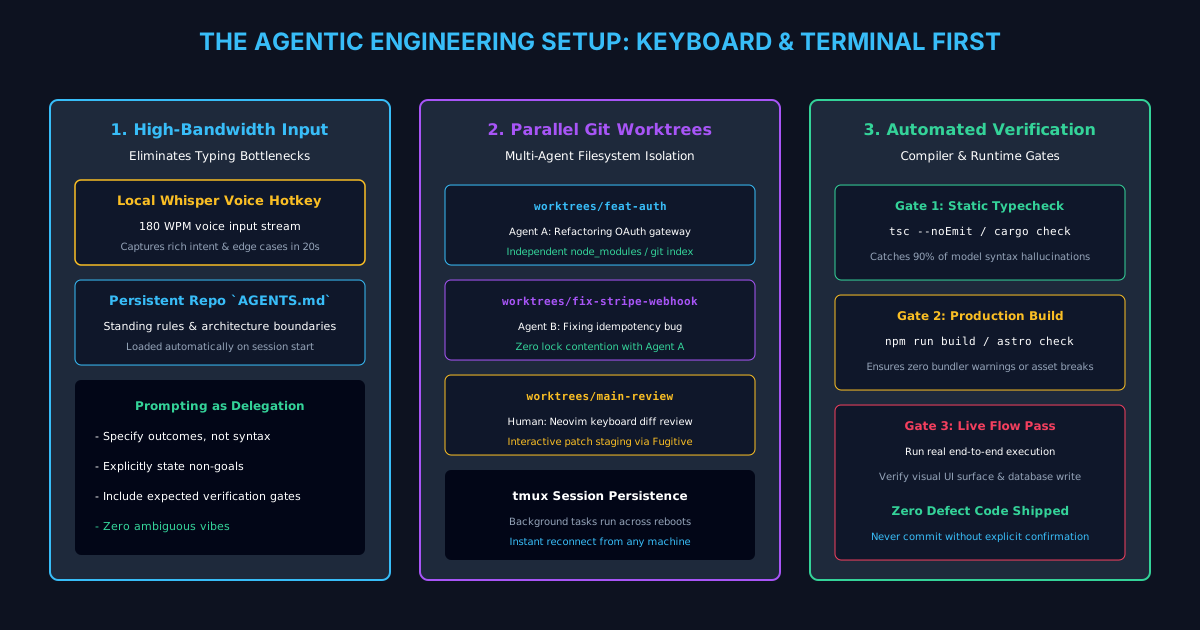
The Agentic Engineering Setup: Terminal, Voice, Worktrees, and Verification
Inside an Ex-Meta L8 engineer's keyboard-first agentic workflow: WezTerm, Neovim, local Whisper voice input, git worktrees, and automated compiler loops.
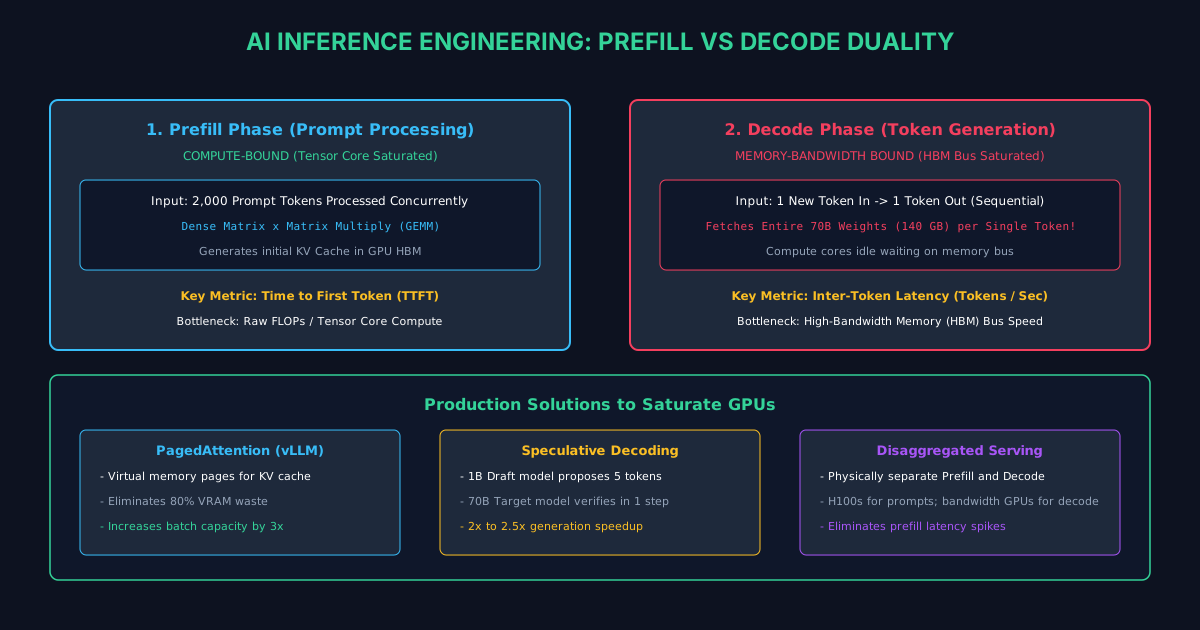
A Complete Guide to AI Inference Engineering: Prefill vs Decode
Why LLM inference splits into compute-bound prefill and memory-bound decode. Master PagedAttention, KV-caching, speculative decoding, and vLLM.
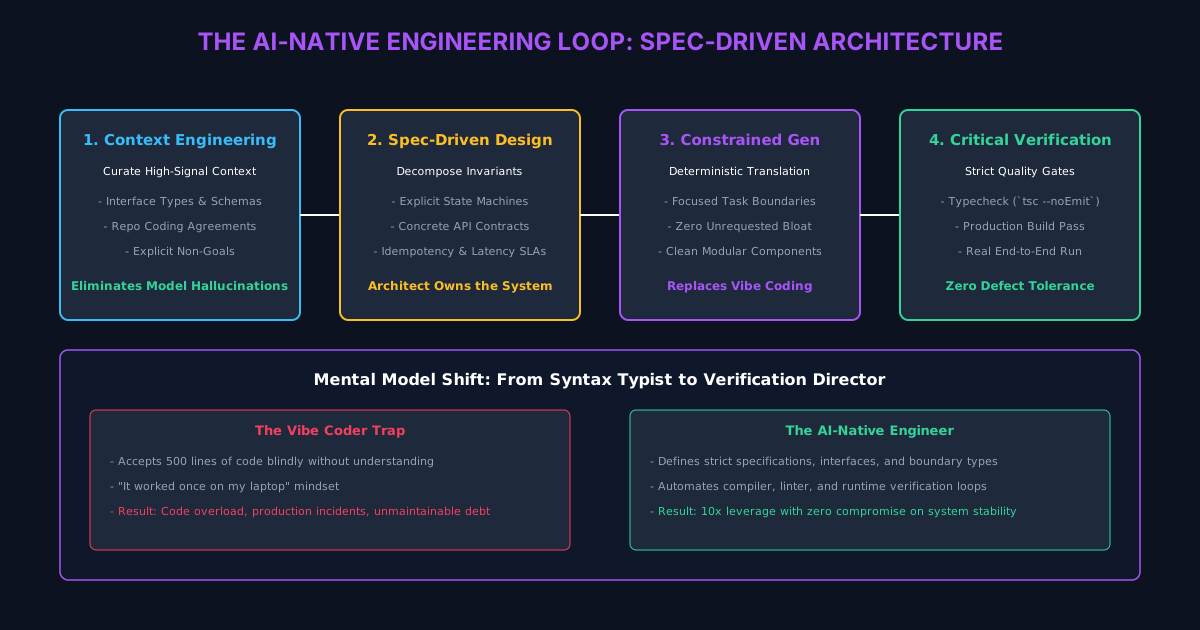
The AI-Native Engineer: Architectural Patterns to Avoid Code Overload
How high-leverage engineers shift from writing syntax to context engineering, specification-driven design, and rigorous automated verification.
/* Comments */
Comments are offline right now — we reconnect automatically, nothing is lost.