topic: distributed-systems
author: Crashtech Editorial
published: Nov 17, 2026 · read: 6 min
---
Inside the Microsoft 365 Gateway Failure: Lock Contention to Cascade
A technical reconstruction of how a gateway lock defect, shifted load and shrinking capacity can turn queued requests into fleet-wide failure.
On this page
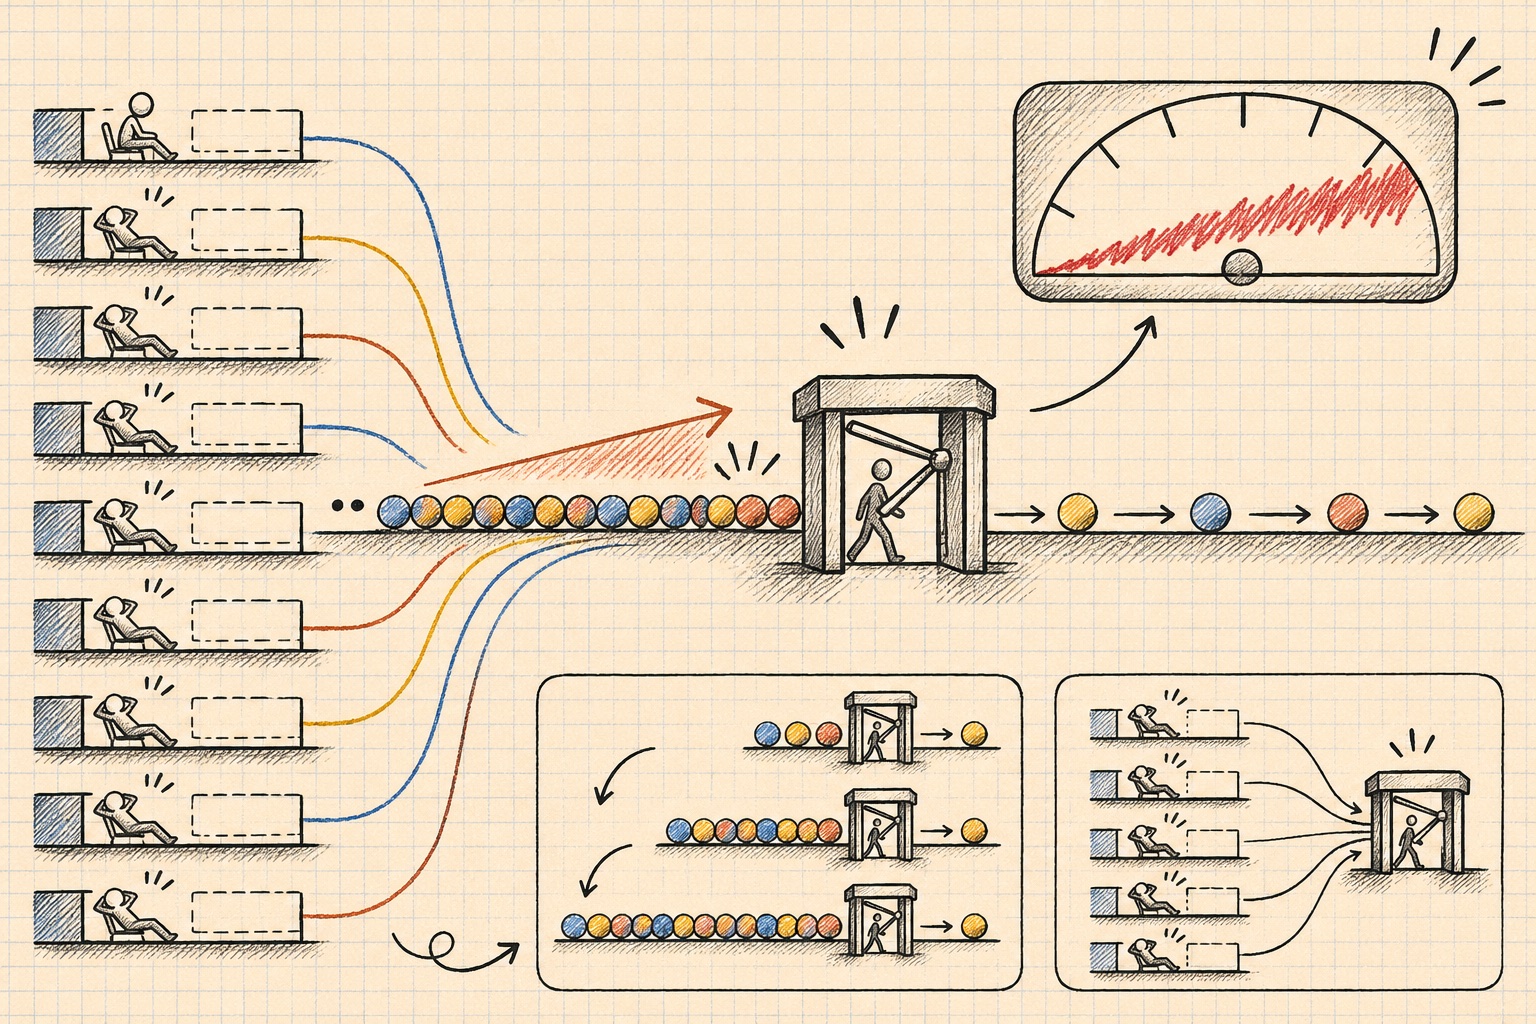
A server can have many cores and still behave like a one-lane bridge. If request-processing threads must pass through a shared lock, only the lock holder can make progress in the protected section. Under low contention, the wait is brief. Under a production traffic mix that creates long hold times or repeated collisions, adding more threads can increase the number of contenders without increasing useful throughput. Microsoft’s preliminary Microsoft 365 review says lock contention inside an internal Windows process exhausted CPU and memory on gateway servers; it does not say which synchronization primitive or code statement was responsible.
What the report establishes
The preliminary Post-Incident Report identifies a latent defect introduced in a fix prepared specifically for Microsoft 365 networking gateway servers. The change began rolling out in July and had been deployed globally for more than three months without observed impact. Microsoft says lab testing missed the behavior because its traffic mix and hardware/SKU distribution differed: contention worsened on newer machines with more cores, while labs tended to emphasize weaker machines with fewer cores. [1]
The triggering environment changed before customer impact. About fifteen hours before the incident, Teams traffic failed over from an alternative heterogeneous gateway to the primary gateway shared with Exchange Online. Separately, almost 14% of the primary gateway’s server capacity was already offline because of an unrelated previous-day issue. The report says neither event alone had exhausted the available headroom; together, changed load and reduced capacity exposed the defect. [1]
Microsoft’s timeline is explicit that the elevated load observed at 19:20 UTC on November 12 was not explained by a general increase in traffic. Many servers had become unavailable, shifting their work onto fewer remaining servers. That distinction separates the initiating conditions from the positive feedback loop that enlarged the incident. [1]
How a hot lock destroys parallelism
Consider a simplified request path with N worker threads and a critical section guarded by one mutex. Let λ be incoming requests per second and s the average time each request holds the lock. Even before considering other work, the lock imposes an upper bound near 1/s critical-section acquisitions per second. If the critical section is short, that bound may be well above the server’s demand. But if a code path lengthens s, or a traffic pattern causes more requests to converge on the same protected state, contention pushes the system toward saturation.
The dangerous region is not just “CPU is high.” Waiting threads may spin, repeatedly attempt acquisition, wake and sleep, or trigger cache-coherence traffic as ownership of a shared lock word moves among cores. Which costs dominate depends on the implementation; Microsoft’s report does not identify them. In a blocking design, a wait still retains thread stacks, request objects and references. If the rest of the system continues accepting work, both runnable contention and parked work can grow. The report’s confirmed facts are the contention and CPU/memory exhaustion, not a particular spinlock or memory-allocation mechanism. [1]
Parallelism can therefore reverse direction. More cores help independent work, but a serialized critical section caps throughput. More worker threads can add context switches and memory retention while they wait for the same lock. A newer high-core-count SKU can expose this path more sharply if the system’s synchronization strategy changes behavior with thread count, contention frequency or scheduling—consistent with Microsoft’s report that the issue worsened on higher-core-count machines. That explanation describes a plausible class of behavior; it is not a claim about the undisclosed Windows implementation.
From contention to fleet cascade
The report’s sequence can be modeled as a feedback system:
changed traffic mix + less spare capacity
                 ↓
      lock contention on some gateways
                 ↓
 CPU / memory pressure and queued requests
                 ↓
      servers stop responding
                 ↓
 traffic manager shifts work to survivors
                 ↓
 higher per-server load → same defect → more failures
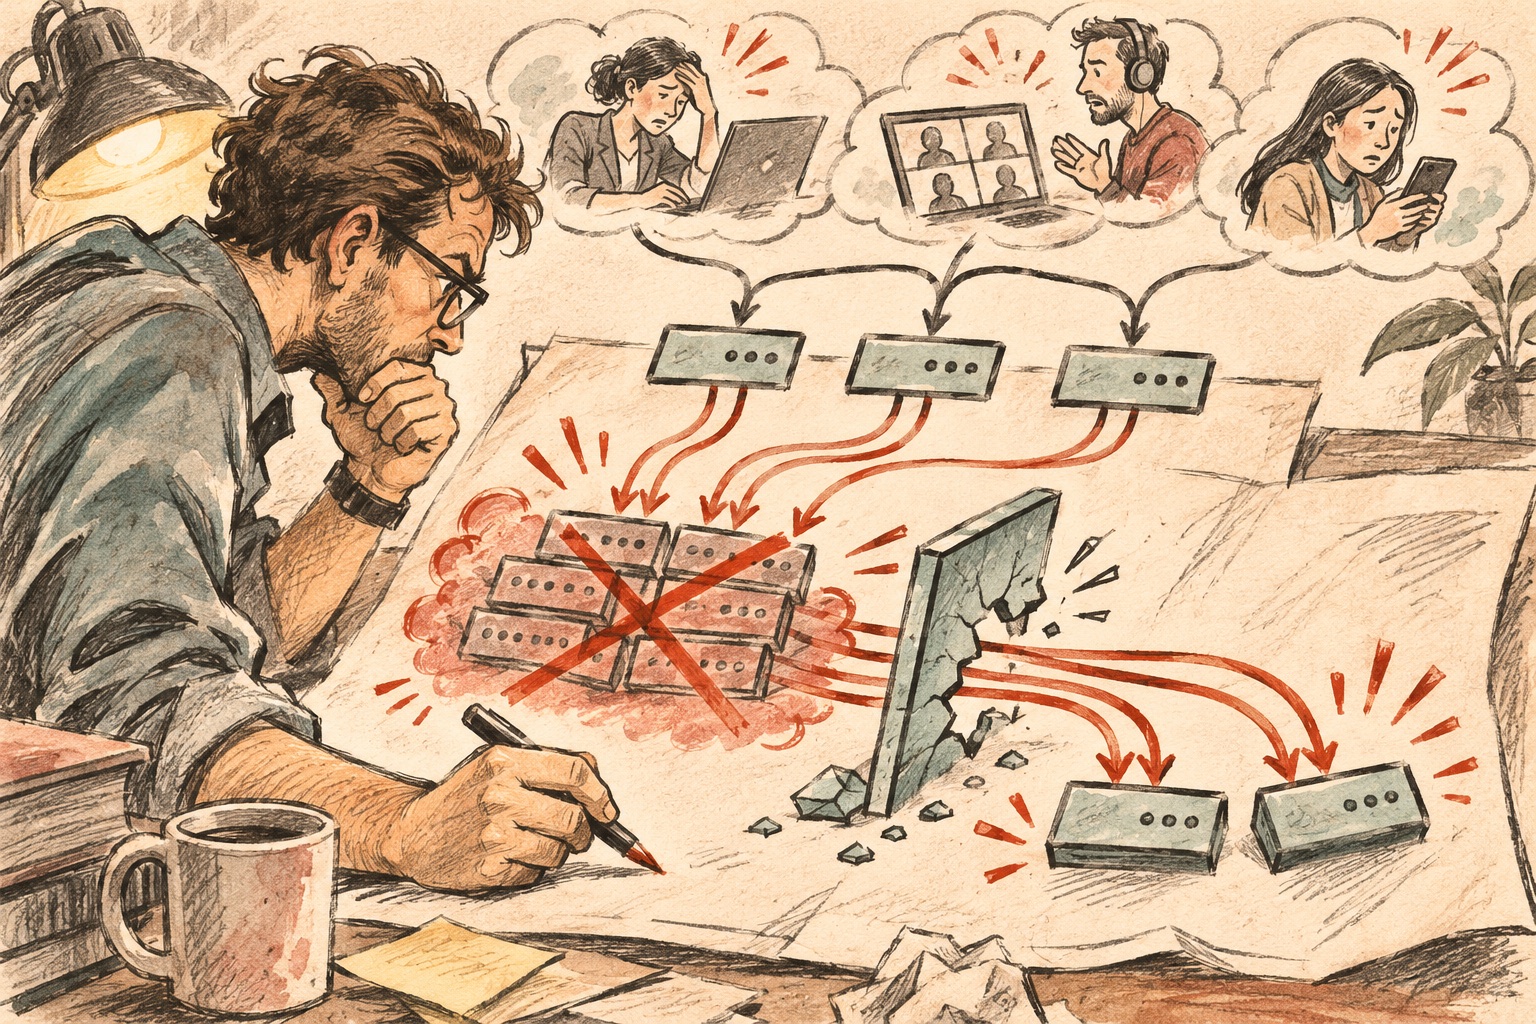
This is the standard shape of a cascading failure: the first failures reduce aggregate capacity, the load balancer tries to preserve service by redistributing traffic, and the survivors receive enough additional work to cross the same failure threshold. Google’s SRE guidance describes this pattern and warns that overload-induced removal of backends can turn local errors into fleet-wide instability. [2]
Queues make the transition harder to reverse. If arrival rate λ exceeds service rate μ, backlog grows at roughly λ − μ requests per second until a bound is reached or resources are exhausted. After traffic falls, the system must process both new arrivals and the accumulated backlog. If a restart immediately exposes a recovered server to the full waiting queue, it may fail before it can reach steady state. Microsoft says returned servers became unresponsive again under waiting traffic, and its usual automated recovery process was not designed for the broad failure state. [1]
There was also a containment gap: the report says a separate issue prevented the normal bulkheads between gateway partitions from stopping the cascade. Bulkheads only help if their control paths, capacity reservations and routing policies remain independent enough to enforce the boundary during the same failure. If the isolation mechanism shares overloaded state or routes all work toward a common pool when partitions look unhealthy, the wall exists on an architecture diagram but not in the failure mode that matters. [1]
Why the rollout passed and why rollback was slow
The test gap was not simply “they did not test.” The defect required a particular conjunction: a traffic mix, a hardware/SKU profile with more cores, elevated load, reduced headroom and a gateway path receiving shifted traffic. A lab matrix skewed toward weaker hardware could miss a concurrency-sensitive path even if it exercised the feature. The remedy is to test the risky interaction, not only to increase generic request volume.
The change had also been deployed for months. That matters because rollback controls are useful only when the faulty behavior remains tied to a reversible unit: a version, configuration, route or feature gate. Microsoft says ordinary rollback, flighting and feature flags could not quickly revert this defect, then reports reverting the connection-handling path to a previously known-good Windows state and restarting infrastructure in groups. The final PIR is expected to add details; as of November 17, the available report is preliminary. [1]
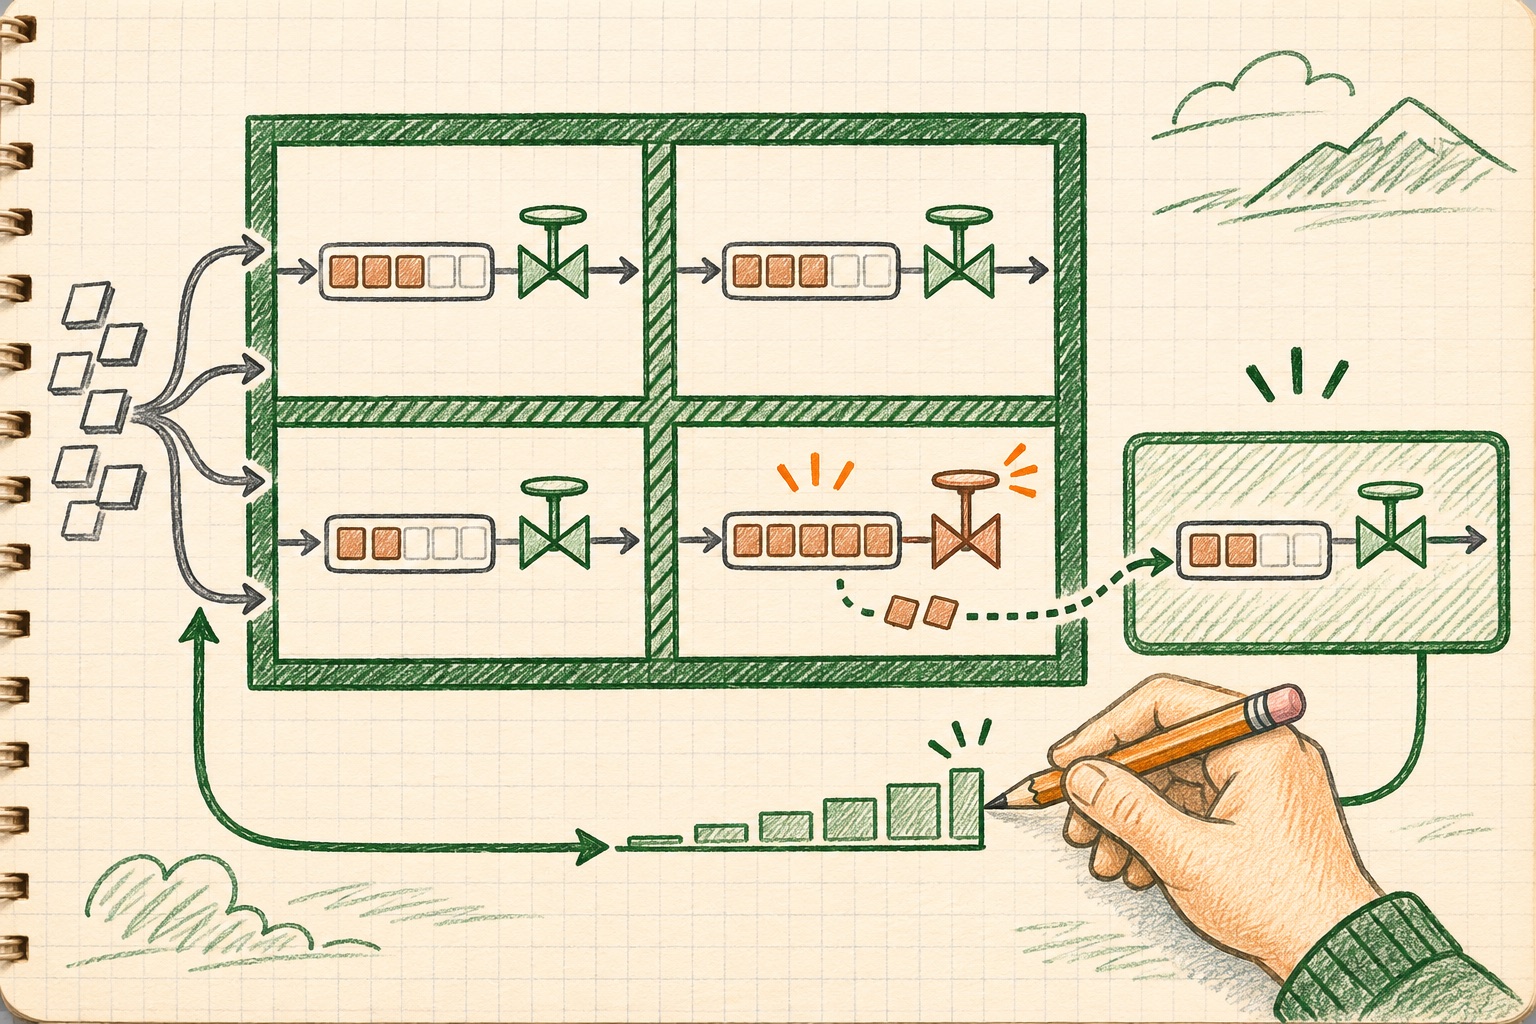
The companion containment design turns this chain into engineering controls: explicit admission limits, bounded queue age, N-1 capacity, independent bulkheads, and slow re-entry. The incident overview is in what happened in the Microsoft 365 outage.
Frequently asked questions
What exactly was the contested lock in Microsoft's gateway?
The preliminary report identifies lock contention inside an internal Windows process on Microsoft 365 networking-gateway servers, but does not name the lock primitive, code path or synchronization algorithm. More specific implementation claims would be speculation until Microsoft publishes more detail.
Why can lock contention exhaust CPU if threads are waiting?
Waiting may consume CPU through spinning, repeated retries, scheduler activity or cache-coherence traffic, depending on the implementation. Even blocking waits add scheduling and wake-up work. The report confirms CPU and memory exhaustion but does not specify which of these mechanisms dominated.
Why did traffic redirection make the outage worse?
Redirecting work away from failed servers concentrates demand on the survivors. If the defect is triggered by per-server load or traffic shape, the healthier endpoints can cross the same threshold, shrinking capacity again and repeating the cycle. Microsoft's preliminary report describes that cascade.
Did Microsoft's report say total traffic suddenly spiked?
No. The timeline says engineers determined elevated load was driven by many servers becoming unavailable and traffic shifting onto the remaining infrastructure, rather than an overall increase in traffic. A prior Teams failover had increased primary-gateway load and changed the traffic mix.
Sources & further reading
Keep reading
Designing Gateways That Fail Without Taking the Fleet Down
A technical blueprint for gateway overload control: N-1 capacity, bounded queues, load shedding, isolated failover and controlled recovery.
The Microsoft 365 Outage Was a Gateway Capacity Collapse
Microsoft's preliminary review traces the November 12–13 outage from a latent gateway defect to cascading server failures and delayed mail.

GitHub’s Bulk AI Scan Makes Fleet Triage Easier, but Preview Is Not Coverage
GitHub now lets organizations start AI Scans across up to 20 repositories at once. Teams still need to scope, review and track the resulting backlog.
/* Comments */
Comments are offline right now — we reconnect automatically, nothing is lost.